Park Performance Assessment
Is your park performing as expected?
If not, do you know why?
Meventus’ multi-step approach for wind park performance assessment, problem identification, and root-cause analysis helps identify under-performing/problematic turbines and find a solution to improve performance


Current Operation Assessment
Identify Under Performing Turbines
Additional Measurements as Needed

Park Performance Assessment
Improving a wind farm’s performance begins with assessing the current operation, as it is important to understand what is occurring in the park, and what any potential problems are before developing a strategy to improve performance. Every park is different, so simply implementing a post-construction product that improved a similar park may not produce the desired results.
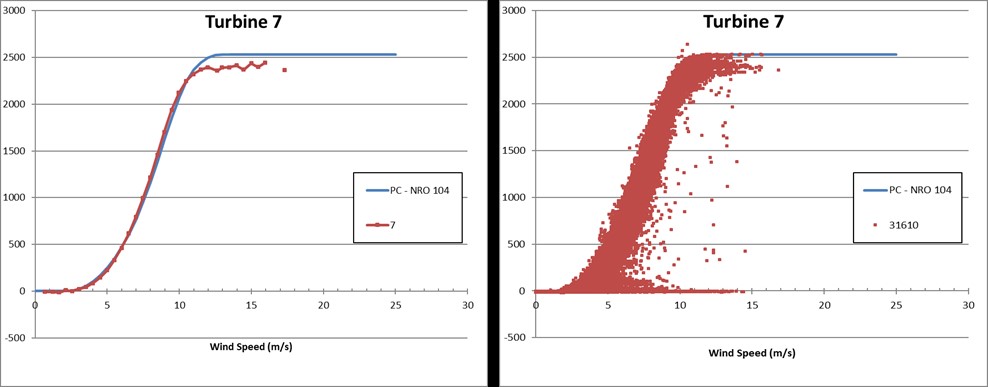
There are many ways to assess a park’s performance. These vary in uncertainty and cost, where the methods with the lowest uncertainty are generally very costly. Our preferred approach is to start with an assessment based on the available park data (SCADA and any wind measurements). One can generally derive a good understanding of the park’s performance using this data, including identifying problem turbines. An ideal situation includes a wind farm with a well-positioned reference mast that can be used to evaluate the accuracy of the nacelle-based anemometers.
As every park is different, the quality of the available data varies and additional measurement may be required in order to complete the investigation. Some examples of additional measurement needs include:
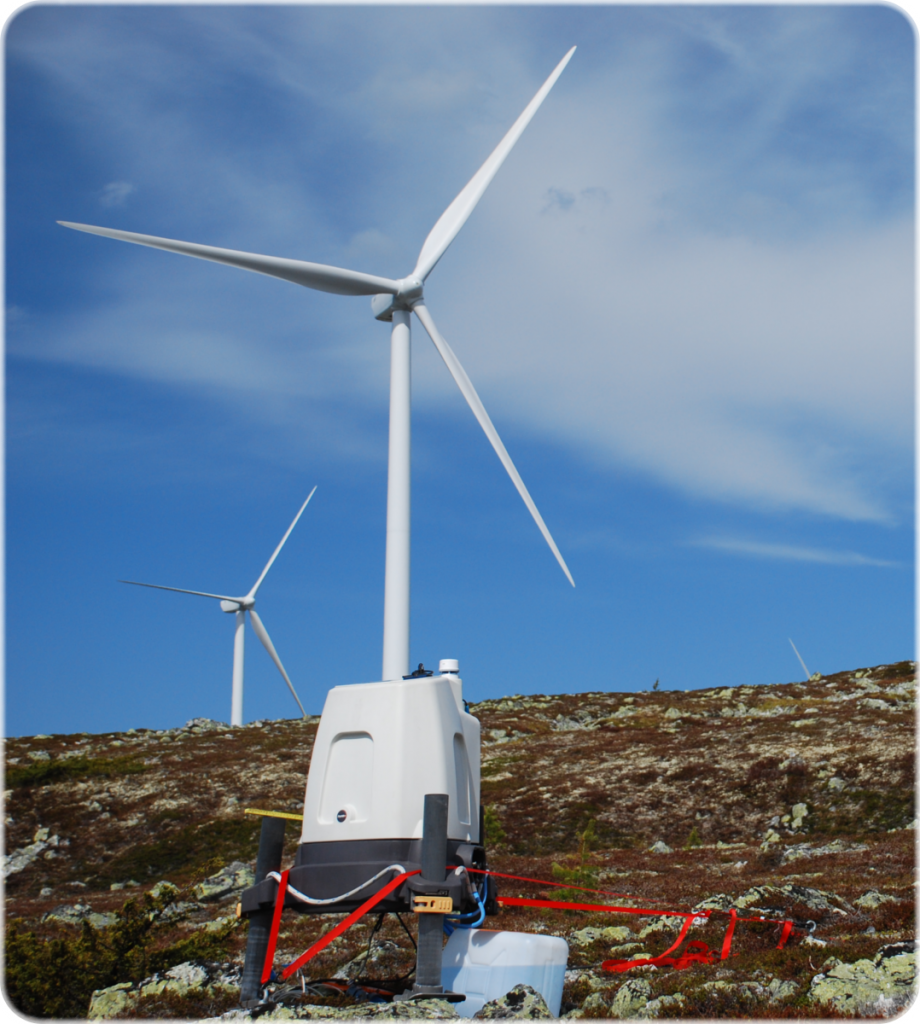
- Ground based lidar upwind from certain turbines in order to evaluate/adjust the wind speed on the nacelle-based anemometers (Nacelle Transfer Function (NTF))
- Ground based scanning lidar to scan upstream from a row of turbines to identify if any turbulent or problematic conditions are impacting individual turbines

Should the performance assessment confirm there is under-performance or problematic turbines, an improvement strategy will be implemented based on the specific needs. At this point, a root-cause analysis is implemented to determine if the cause is related to the wind conditions or a turbine fault. This analysis includes assessing the SCADA data with machine learning algorithms to identify relationships between certain parameters and the fault behaviors. Additional sensors may be installed on an as-need basis.
A performance improvement strategy will be developed once the problems are identified.
Some examples of improvement measures include:
- Nacelle mounted lidar to evaluate/adjust the yaw alignment (Can also be used to reduce the uncertainty of the power curve evaluation)
- Curtailment recommendations
- De-rating of turbines based on problematic wind conditions/layout

Meventus –
Would you like to work with us?
If you have an upcoming project in wind and you think we can help you,
please feel free to contact us, we’ll get back to you as soon as possible.


